
Create the exact technical graph you want with
SigmaPlot
Easily Create Your Exact Graph
Fast graph creation starts with SigmaPlot's
award-winning interface. Take advantage of industry
standard menu design, menu toolbars, right mouse
button support and graph preferences. Quickly select
the graph type you want to create from the
easy-to-read icons of the Graph Toolbar. The
interactive Graph Wizard leads you through every step
of graph creation. Set your favorite graph preferences
with Graph Defaults. And, to create similar graphs
again and again, make your graph a template.
Quickly Customize Every Detail
SigmaPlot® gives you the flexibility to customize all graph
attributes. Double-click on any graph element and
SigmaPlot brings up the Graph Properties dialog. Choose
from easy-to-read bitmapped selections. Create standard
error bars. Specify different colors, sizes and symbols for
each data point. Insert axis breaks, and much more. Click
"Apply" to preview your modifications. Then tab between
sections of the dialog to customize your graph further. Put
finishing touches on your graphs with the scientific text
editor. Choose any combination of Windows system fonts
in any color or style. You can annotate your graphs further
by pasting equations, symbols, maps and other images into
your presentation!
Customize your SigmaPlot graph the way you want with the
streamlined Graph Properties dialog
Clearly Present Exact Scientific Ideas
Compare and contrast trends in your data by creating multiple curves per graph, multiple axes per graph,
multiple graphs per page and multiple pages per worksheet. SigmaPlot provides you with amazing
technical graphing flexibility. SigmaPlot's true WYSIWYG page layout gives you complete control over
your presentation.
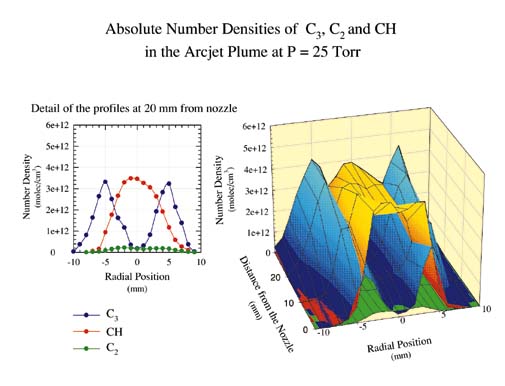
From simple 2D scatter and line plots to compelling contour plots, SigmaPlot
gives you the exact type of graph you need for your demanding
research. And -- to help you see complex interactions in your
3D data -- SigmaPlot powerfully renders multiple intersecting
3D meshes with hidden line removal.
Make Your Point Anywhere
Create stunning slides, incorporate your graphs in reports, further customize your graphs in drawing
packages or send graphs to publishers with SigmaPlot's graphic file export options. You can display your
graphs on the World Wide Web with the JPEG export command. Create customized reports with the
Report Editor within SigmaPlot. SigmaPlot is both an OLE 2 container and server. You can use Word's
Equation Editor, WordArt or any other OLE object inside your graph page or your report. Or, embed
your graph in any OLE container-word processors,
PowerPoint®, or graphics programs. Just double click
and you can edit them directly inside your document.
The Tools You Need
to Solve Your Data Analysis Problems
SigmaPlot provides all the fundamental tools you need to analyze your data from basic statistics to
advanced mathematical calculations. Click a toolbar button to instantly generate summary statistics
including 95% and 99% confidence intervals. Run t-tests and linear regressions with ease, fit a curve or
plot a function and get a report of the results in seconds, use built-in transforms to massage your data and
to create special graph types AND automate everything you do.
With SigmaPlot it's all so simple!
Fit Your Data Easily and Accurately
Curve fit your data with a few mouse
clicks as the Regression Wizard guides
you through the process. The
Regression Wizard automatically
determines your initial parameters,
writes a statistical report, saves your
equation to your SigmaPlot Notebook,
and adds your results to existing graphs
or creates a new one! SigmaPlot offers
robust multidimensional nonlinear curve-
fitting, piecewise continuous,
multifunctional, weighted, Boolean
functions and more-up to 10 variables
and 25 parameters. You can even add
your own powerful curve fits to the
Regression Wizard.
Use the Regression Wizard to curve fit one of more than 100 built-in
graphically-illustrated equations or your own. The Regression
Wizard leads you through every step of the curve fitting
process.
Plot Matematical Functions with the Function
Wizard
Visualize mathematical models by plotting 2D and 3D functions. Plot a function by selecting it and
specifying the parameters and the range. Create your own functions and save them for future use. Plot
functions on new or existing graphs or even plot multiple functions simultaneously using different parameter
values. You can plot functions over any specified range,
including axis ranges.
Easily plot more than 100 built-in graphically-illustrated functions
or your own using the Function Wizard.
Easy-to-Use Data Management Tools
Manipulate more than one billion data points in SigmaPlot's powerful scientific data worksheet. Organize
graph pages, SigmaPlot or Excel data worksheets, curve fit results and reports effectively in the SigmaPlot
Notebook.
Use The Power of Excel Inside SigmaPlot
Create or open an existing Excel spreadsheet to analyze your data-Excel's menus seamlessly merge with
SigmaPlot's menus. Use Excel in-cell formulas, pivot tables and macros and then analyze and graph your
results from an Excel spreadsheet right within SigmaPlot.
SigmaPlot is SigmaScan Pro and
SigmaStat compatible.
SigmaPlot Features
Windows System Requirements:
Windows 95 (Rev B), 98, 2000, NT 4.0
Pentium 200 or clone
64 MB or more of RAM
48 MB of disk space
CD ROM Drive
SVGA/256 color graphics adapter (800 x 600,
High Color recommended)
To use HTML Help, Internet Explorer 4.01 or
later required.
Sales of SigmaPlot is restricted to the
U.S. and Canada only.
Home ||
Shopping Cart ||
Site Map ||
Newsletter/Blog
Search HALLoGRAM ||
Request More Information
CALL TOLL FREE 1-866-340-3404
|

