
VisualSoft JBChart is an unrivalled; feature rich and customizable Java
Bean, which presents charts and graphs with great looks in a quick and easy
way.
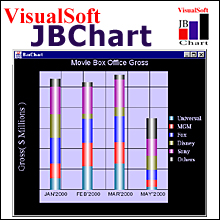
Draw the chart you require - Pie, Bar, Line, Area, Column, Stock, XY-Scatter,
Radar, Bubble, Doughnut, Cone, Cylinder, Dial, Triangular and Box charts.
Set a header for the X-Axis and Y-Axis. Select a name and color for a series
of data, incorporate images in the background, show/hide footer, header, y-axis
and legend.
VisualSoft JBChart can be used in applets and can also generate images (JPG,
PNG, BMP and WBMP), to enable the chart in web applications and web pages. It
gives web developers the power to add life to data quickly.
Rose Models
VisualSoft JBChart now comes with a Rational Rose� Model (.MDL).
Note: The Rose Models are packaged with the FULL version of VisualSoft JBChart.
Where it can be used?
It can be used in presenting powerful reports that provide vital analysis,
statistical information necessary to make crucial decisions.
Integrate JBChart in any of the following applications to enhance their
charting and reporting power:
- Financial Management
- Analysis and Reporting applications
- Customer Relation Management
- Logistics Management Services
- Network Monitoring Tools
- Post and Pre-Sale analysis
- Scheduling Services
What's New in JBChart 3.4
- Full version of VisualSoft JBChart 3.4 comes with Rose Models
- Double value data support
- Double value support for Grid lines and Step values for all the Axis
- Save charts as PNG, BMP, WBMP and XML formats
- Modified XML data source to include both data and properties
- Secondary Y-Axis support for BarWithLine and Stock charts
- Stock chart variations include Stock with Line and Stock with Area
- Facilitates Zooming
- Box chart
- All new Triangular charts with six variations -
- Simple Triangular
- Simple Stacked Triangular
- Simple Percent Triangular
- Horizontal Triangular
- Horizontal Stacked Triangular
- Horizontal Percent Triangular
Key Features
- with 58 variations
- Z-Axis support for Bar, Line, Area and Cylinder charts
- Set images for Chart series
- Edit chart data with a right mouse click (double click) on the chart series
- Drill-down feature - An event fires whenever the user clicks on the chart series
- Supports data sources - CFL, XML, TableModel, Applet, ResultSet and Flat File
- Save charts as JPEG, SVG, XML and CFL formats
- Multilingual support
- Automatic scale
- Hatching - fill different types of patterns viz.
Horizontal, Vertical, 45 degrees, mixed with different foreground and background colors.
- Rotation of X-axis labels - rotation of axis titles through 360 degrees
- Different grid styles - Measurement of the chart against the axis
- Labels for the charts Add labels to all segments in a chart in different positions.
- Z-Axis support for
- Line charts
- Cylinder charts
- All new Cylinder charts includes 2D and 3D charts
- 2D Cylinder charts
- Simple Cylinder
- Column Cylinder
- 3D Cylinder charts
- Simple Cylinder
- Simple Stacked Cylinder
- Simple Percent Cylinder
- Simple Cone
System Requirements:
- Win 95/98,2000, Windows NT 4.0
- IE ver 5.0 and above
- Netscape 4.75 and above
- JDK 1.3 for SWING
VisualSoft JBChart is "electronically
delivered" only

